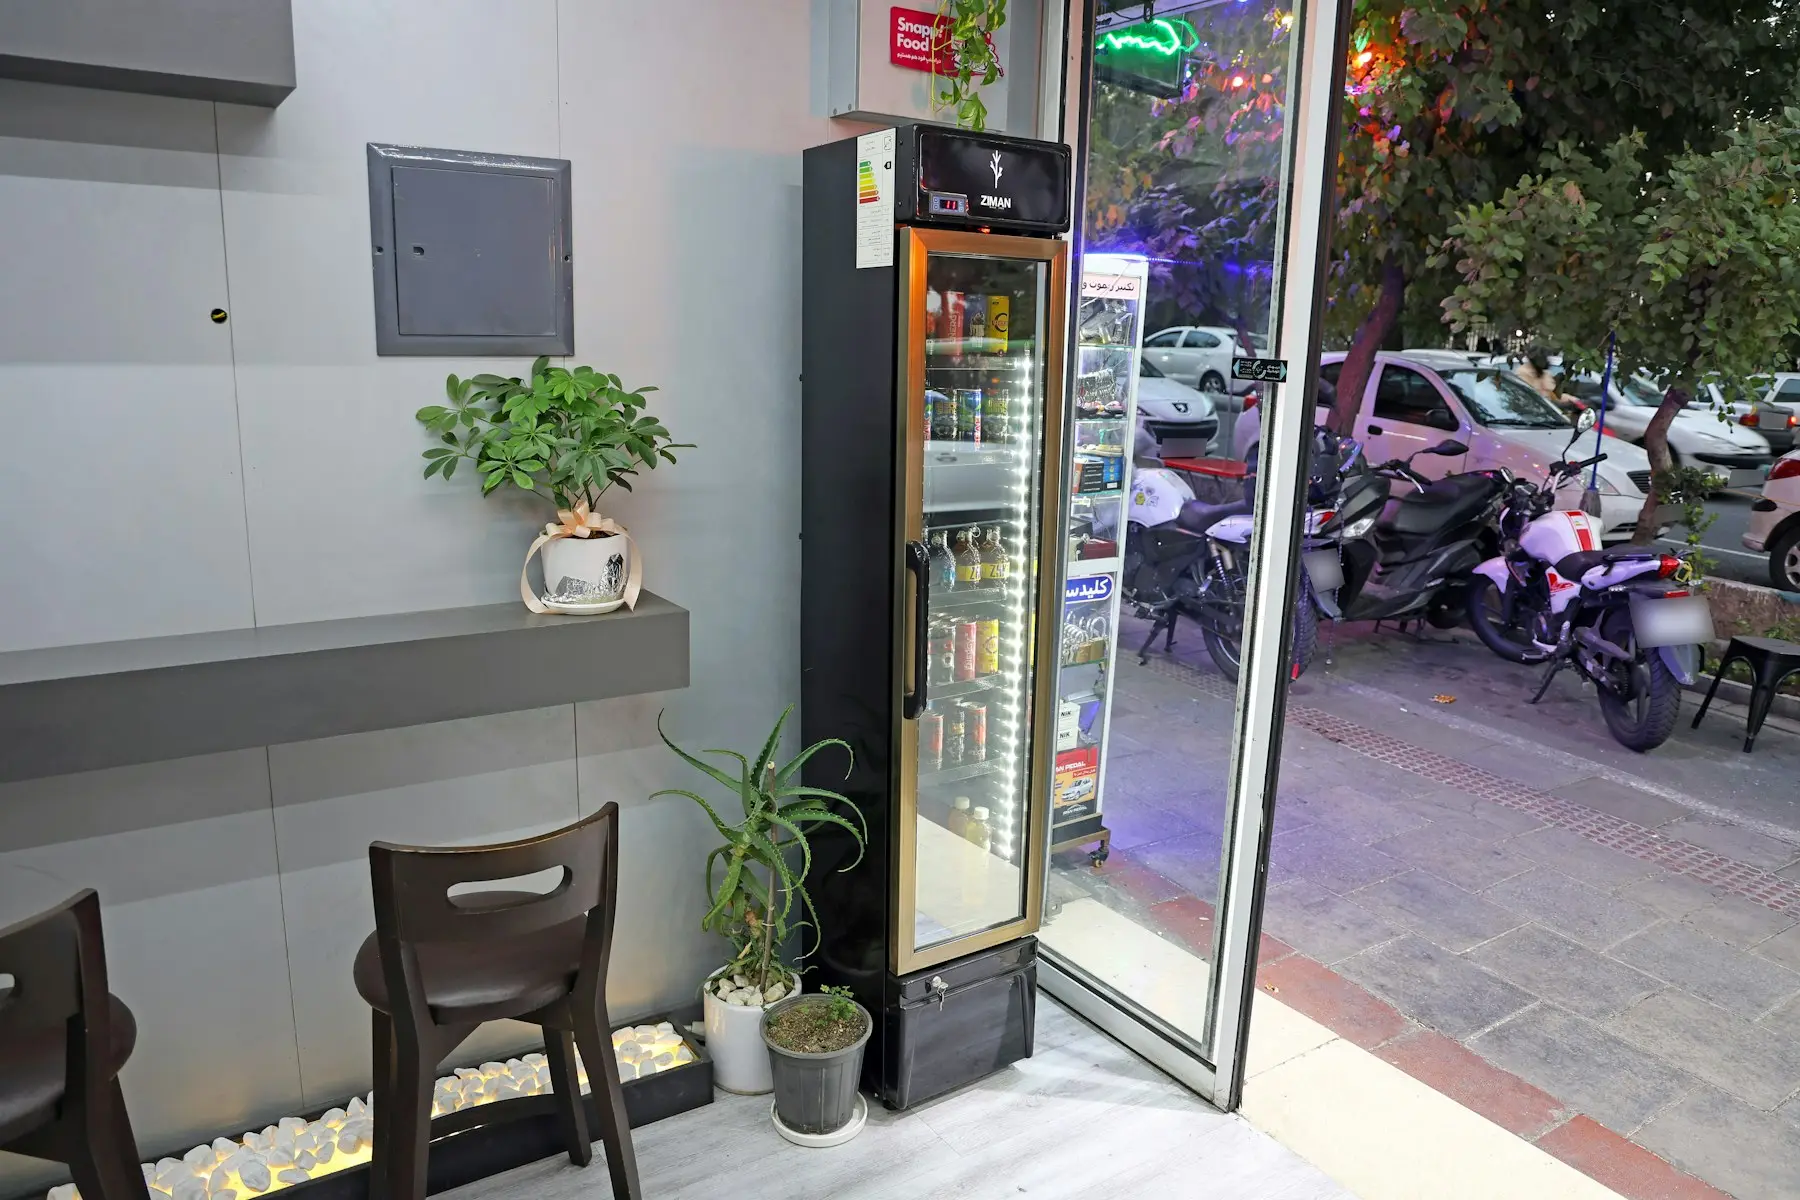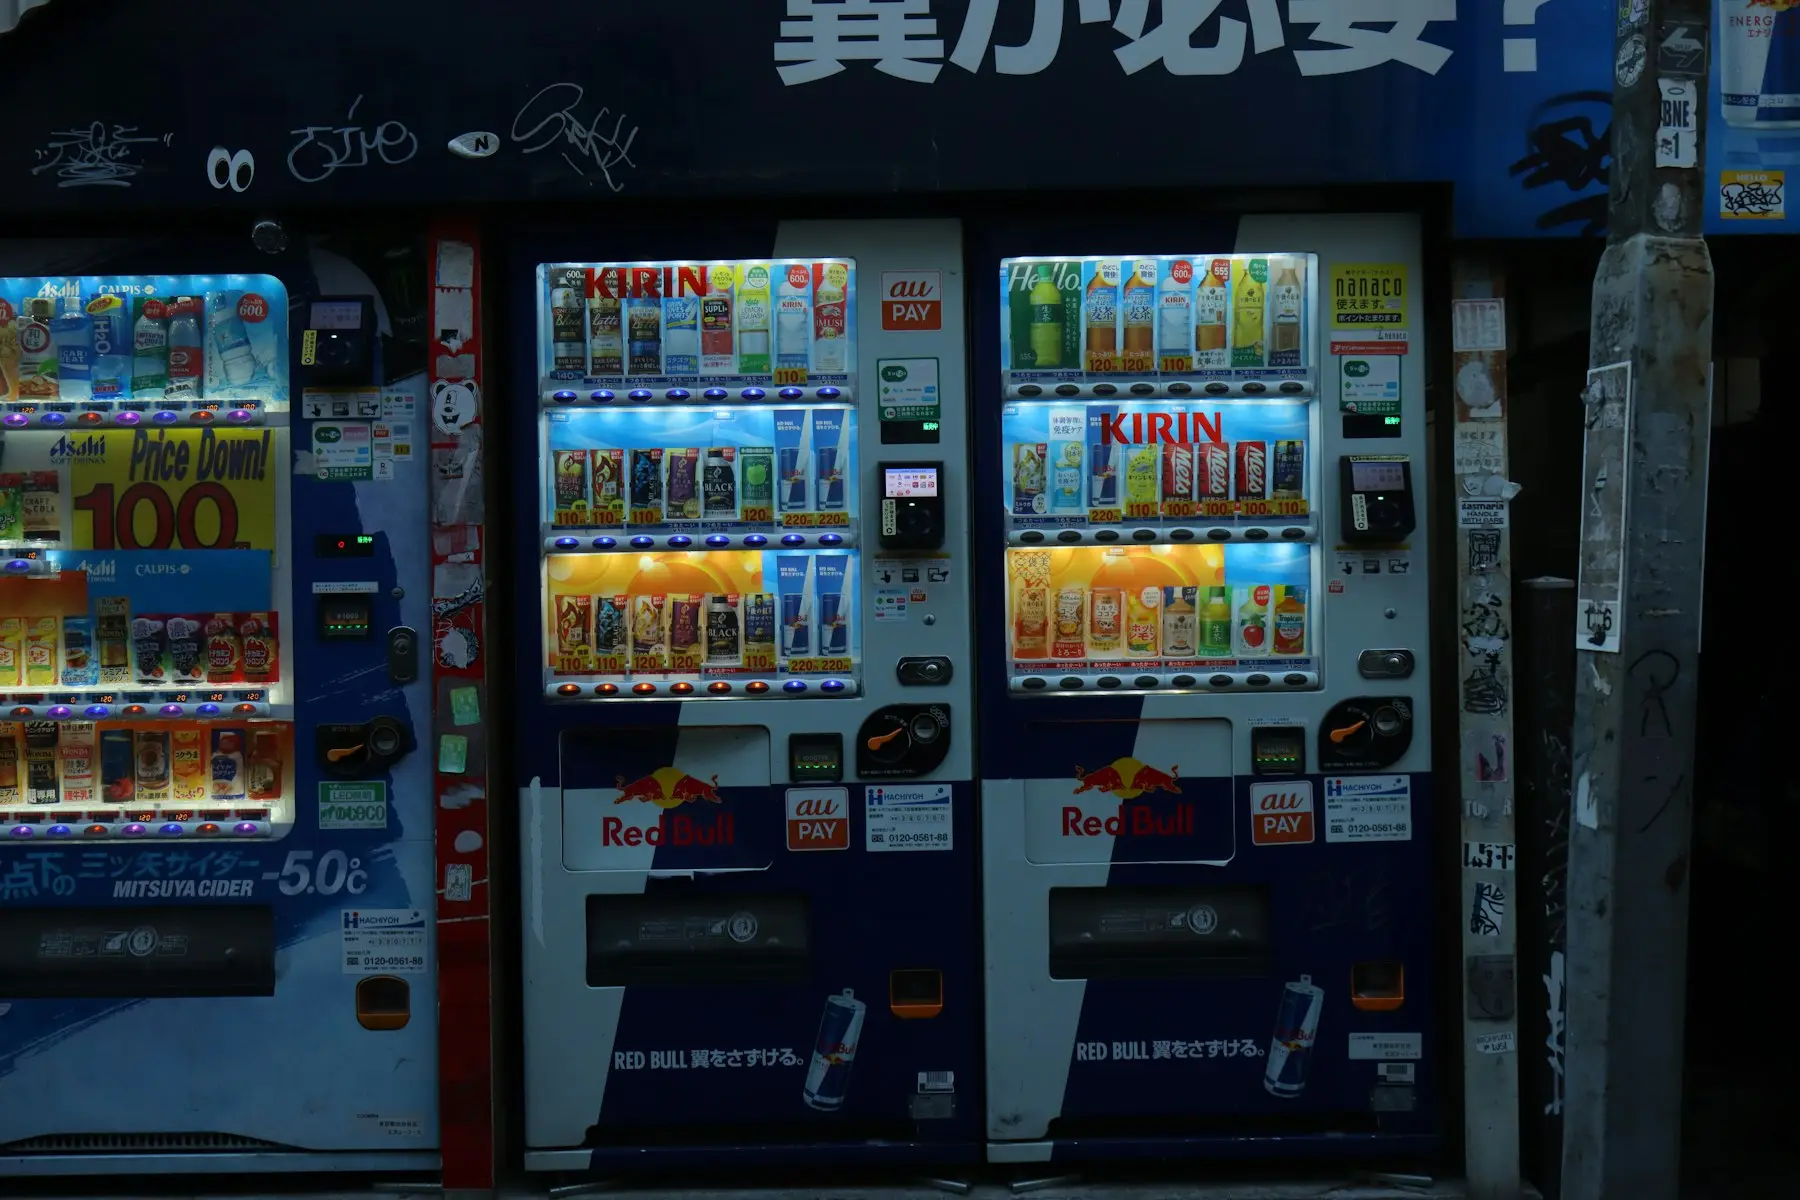
One of our smart coolers sells about $500 a month at a gym. After product, card fees and a 15% commission, $272 of that is left, before our time and any platform fee. No trade survey publishes what the average machine sells; the closest figures come from the payment companies’ filings, which work out to about $224 to $367 a month of card and phone sales per connected device.
The calculator above starts from this cooler. Change the monthly sales, product share, card fees and commission to your own location’s numbers and it does the same subtraction. What the $272 means once the machine’s price, a loan and your hours are in is covered in are vending machines profitable. This page is about the top line: what machines sell, and what comes off it before anything reaches the operator.
Vending machine revenue per machine: what is published
Three kinds of source publish something close to a per-machine number. None of them is a survey of what the average machine sells today.
Trade press: revenue and machine counts from the same report
Automatic Merchandiser’s 2026 State of the Industry report1 estimates 2025 convenience services revenue at $40.04 billion, covering vending, micro markets and smart coolers. Its public summary gives no count of machines, so it cannot be turned into a per-machine figure. Industry numbers for 2026 has the rest of that report.
The most recent edition we found that gave both numbers is older. A 2016 Automatic Merchandiser article quotes its 2015 State of the Vending Industry report2 at $20.7 billion in annual revenue from 5.1 million vending machines. Both numbers come from that one report, so the division holds: about $4,059 a year, or $338 a month, per machine. The same article gives $25.6 billion from 3.3 million machines for 2000, which is about $646 a month. The article does not say whether the 2015 revenue includes micro markets or office coffee, and the figure is a decade old.
Payment companies: card and phone sales per connected device
The two largest vending payment companies report their transaction volume and how many devices they serve. Dividing one by the other gives cashless sales per device.
| Source | Period | Cashless volume | Devices | Per device, per month |
|---|---|---|---|---|
| Cantaloupe 10-K | Year to June 30, 2025 | $3.444 billion | 1.28 million active | about $224 |
| Nayax results | Calendar 2025 | $6.449 billion | 1.463 million at year end | about $367 |
Cantaloupe’s 10-K3 defines an active device as one that has communicated or had a transaction in the last twelve months, and counts only electronic payments. Its filing also gives 1,199 million transactions, so the average card or phone purchase was about $2.87. Nayax’s results4 are worldwide and give 2.873 billion transactions, about $2.24 each.
Four things pull these figures away from what a single snack machine or cooler sells:
- Cash is not counted. On Cantaloupe’s network, 78% of food and drink vending sales were cashless in 2025, per its Micropayment Trends Report5.
- Both companies serve more than food and drink vending. Their filings name amusement, laundry, kiosks and EV charging among their markets, and Nayax’s figures are worldwide.
- A device that sold for one month of the twelve counts the same as one that sold all year.
- Nayax’s device count grew 16.1% during 2025, so dividing by the year-end count understates the average.
I’d use these per-device figures as a rough cross-check on a forecast for one machine, and no more than that.
Vendor claims
Sellers of machines publish their own numbers. These are marketing, and neither page below shows data behind its figure.
- Micromart’s FAQ6, answering a question about annual revenue, says its operators earn $14,400 a year per machine on average, about $1,200 a month, and that results vary with placement and product. It does not say whether that is gross sales or what the operator keeps.
- VMFS7, which sells machines, puts gross revenue at $300 to $700 a month for low-traffic locations, $800 to $1,500 for moderate traffic and $1,500 to $3,000 or more for high traffic. It cites no source.
I’d leave both vendor figures out of any plan until the seller shows what they are based on.
We could not find average monthly sales per machine from NAMA, from any smart cooler platform, or from Cantaloupe’s or Nayax’s own marketing pages.
What drives how much a vending machine makes a month
Gross sales are the number of purchases times the average price. Each of the inputs below moves one of those two.
People on site. Micromart recommends a location with 150 or more people on site each day for its machines (Micromart FAQ6). Locator companies price placements by headcount for the same reason; locator prices has their tiers.
Price per item. The average vending purchase on Cantaloupe’s network was $2.01 in 2025. Micro markets averaged $3.02 and Cantaloupe’s Smart Stores, its cooler format, $4.49 (Cantaloupe5). A cooler that holds sandwiches and meal-sized drinks sells at a higher ticket than a spiral machine of chips.
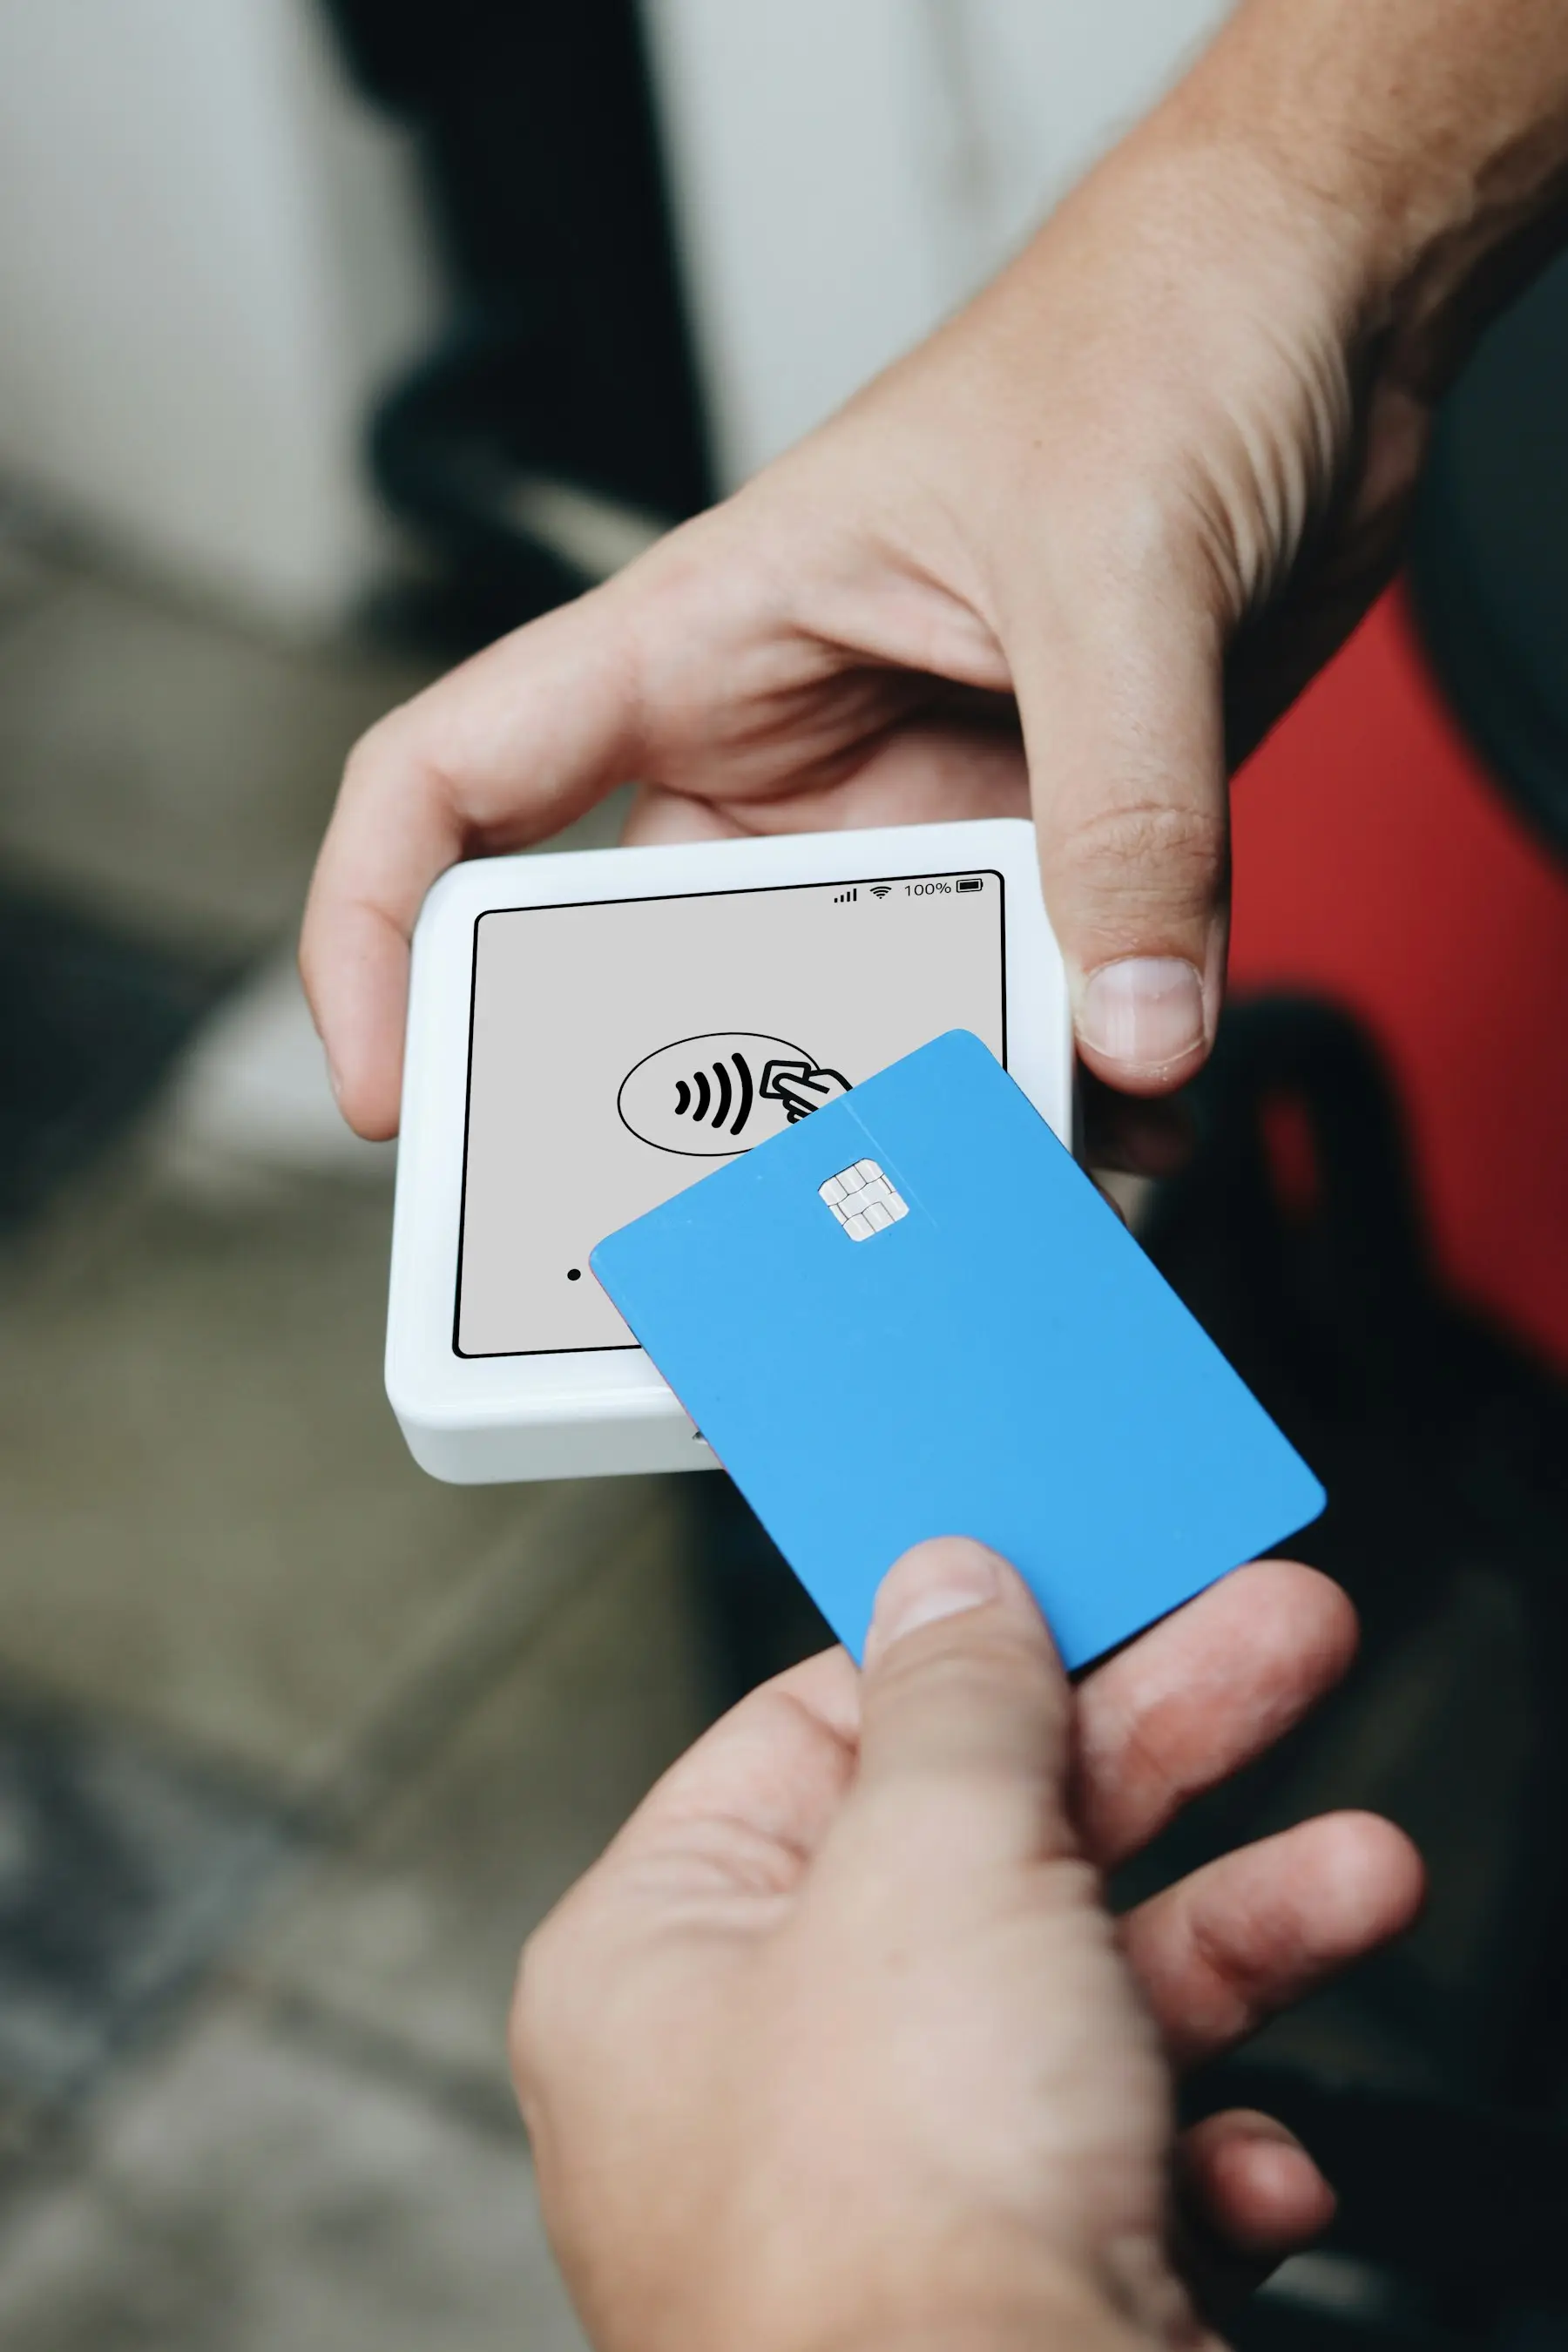
Card acceptance. The average card purchase on Cantaloupe’s network was $2.45 against $1.57 in cash, and 85% of cashless sales were contactless (Cantaloupe5). A machine without a reader loses the purchases of people who carry no cash. With 78% of food and drink vending sales on Cantaloupe’s network already cashless, I wouldn’t place a machine without one. Card readers compared has the fees for each.
Product mix. In the 2026 State of the Industry survey, snacks, candy and sweet baked goods were still more than a third of vending and smart cooler sales, and operators named jerky, protein bars and fresh food as their leading better-for-you lines (Automatic Merchandiser1). Mix also changes what comes out, through product cost and sales tax.
Shrink. Product that leaves without being paid for lowers sales against what you loaded. Micro market figures and the lack of any smart cooler figure are in industry numbers.
What comes out of gross sales
Every line below is taken from the same gross figure, so each percentage point on a $500 month is $5.
Product
Ours runs about 25% of sales on the gym cooler. No survey publishes an average cost of goods for vending, and it varies with what you stock and where you buy it. Enter your own in the calculator.
Card fees
Ours are 4% plus $8 a month, which is $28 on $500. We run Nayax and WeVend readers. On Cantaloupe’s Engage reader, at 5.95% plus $9.95 a month (Cantaloupe store8), the same month costs $39.70. As more of a machine’s sales move to cards, this line grows with them.
Commission
One of our locations takes 15% of gross sales, which is $75 on $500. A vendor blog, VendBuddy9, puts commissions at 5% to 20% of gross sales, with gyms at 10% to 18%, hospitals at 12% to 20% and small offices at 0% to 5%. It cites no survey, and we found none from NAMA or the trade press. Check whether your agreement calculates commission on sales before or after sales tax. Because the rate comes off every dollar of gross, I think it is the placement term most worth settling in writing before the machine goes in.
Sales tax
In California, vending prices are presumed to include sales tax, so the tax comes out of what the machine took in (CDTFA Regulation 157410). Cold food and hot drinks sold through a machine are taxed on 33% of receipts; carbonated drinks are taxed in full. California vending sales tax works through a month by product.
Platform fees for smart coolers
A smart cooler adds a monthly software fee and, on most platforms, a charge per transaction. On $500 of sales, the platforms that publish exact fees take $64.75 to $177.50 a month, card processing included (smart cooler fees compared). Our receipt above shows card fees only; enter a platform fee in the calculator’s other monthly costs field.
The same machine at other sales levels
Product, card fees and commission are percentages, so they scale with sales. The $8 card fee and any platform fee do not, which is why a slow machine keeps a smaller share of each dollar. With our rates:
| Gross sales a month | Product, 25% | Card fees, 4% + $8 | Commission, 15% | Left |
|---|---|---|---|---|
| $250 | $62.50 | $18.00 | $37.50 | $132.00 |
| $500 | $125.00 | $28.00 | $75.00 | $272.00 |
| $1,000 | $250.00 | $48.00 | $150.00 | $552.00 |
At $250 a month the operator keeps 52.8% of sales; at $1,000, 55.2%. The $8 is 3.2% of a $250 month and 0.8% of a $1,000 one. A smart cooler’s fixed platform fee widens the gap the same way.