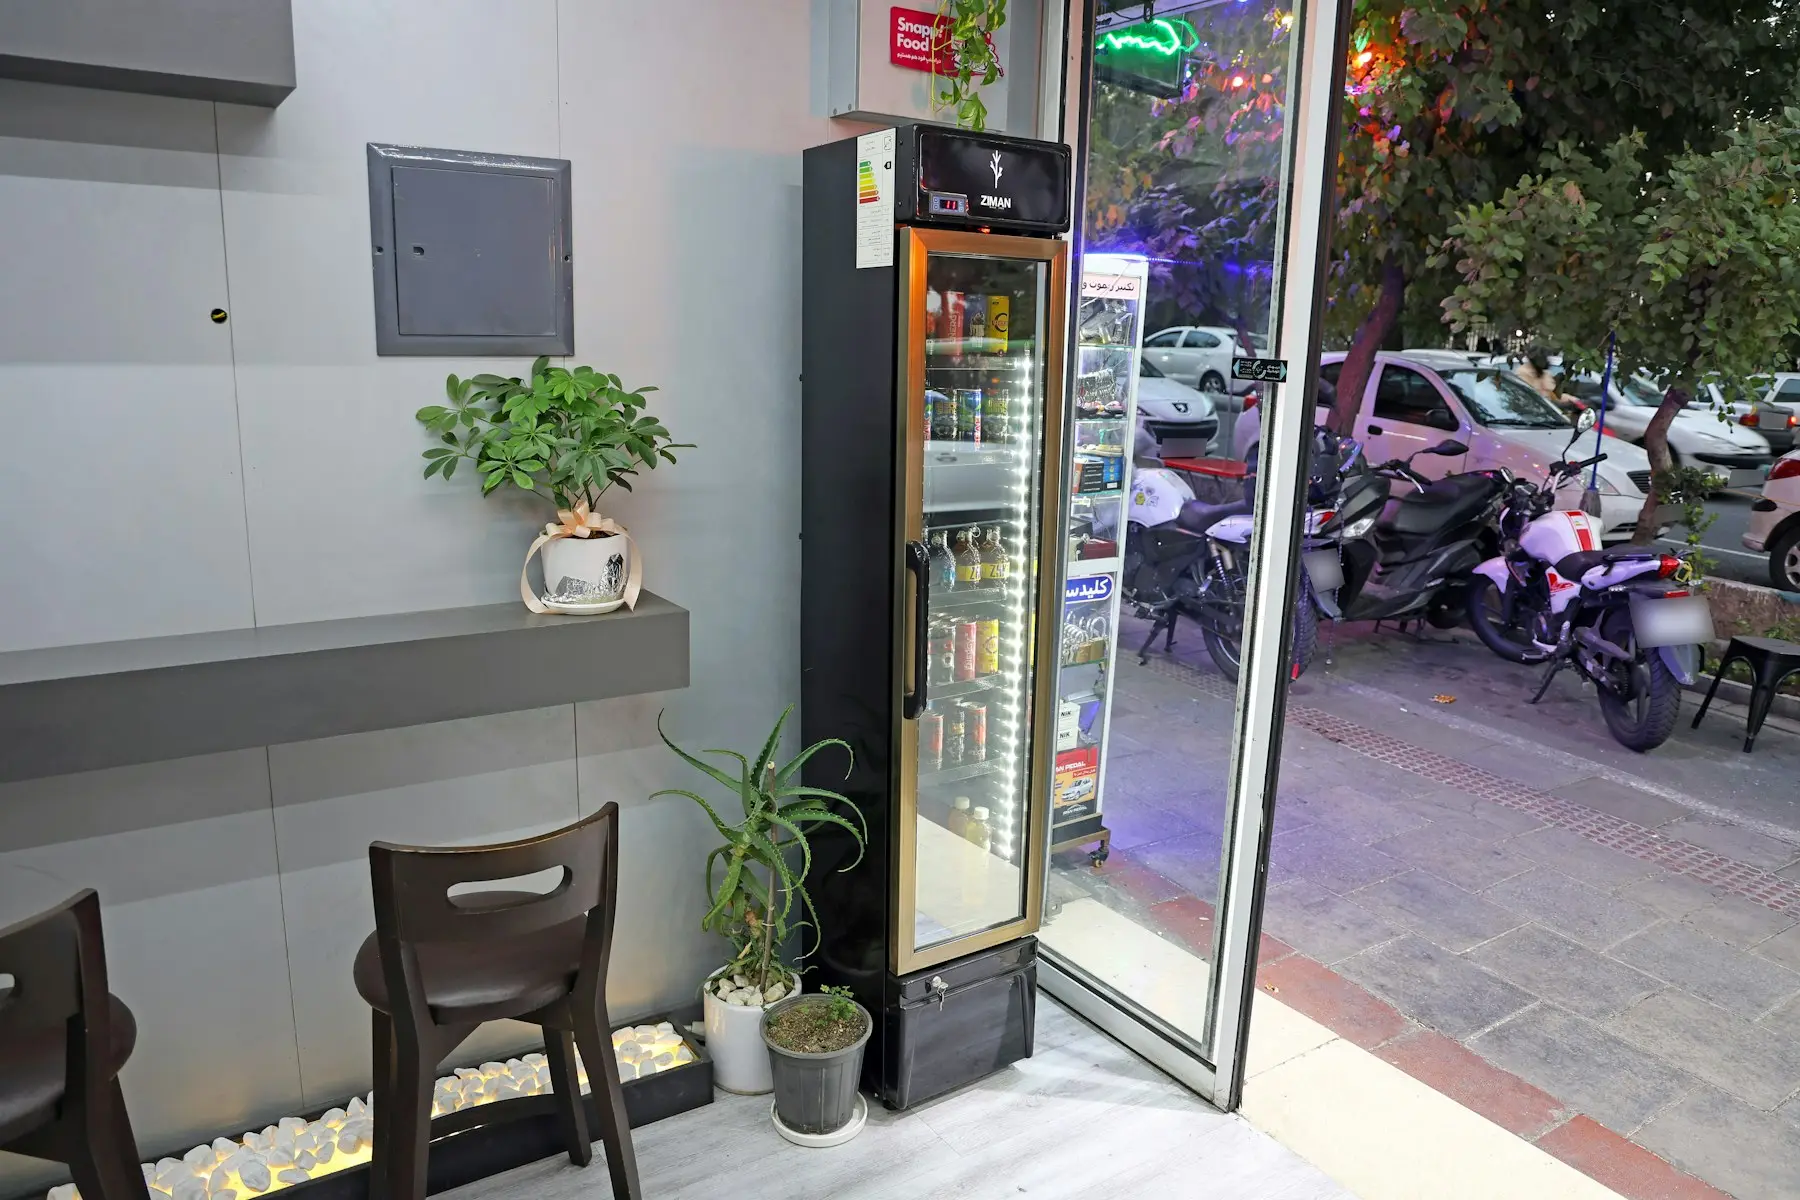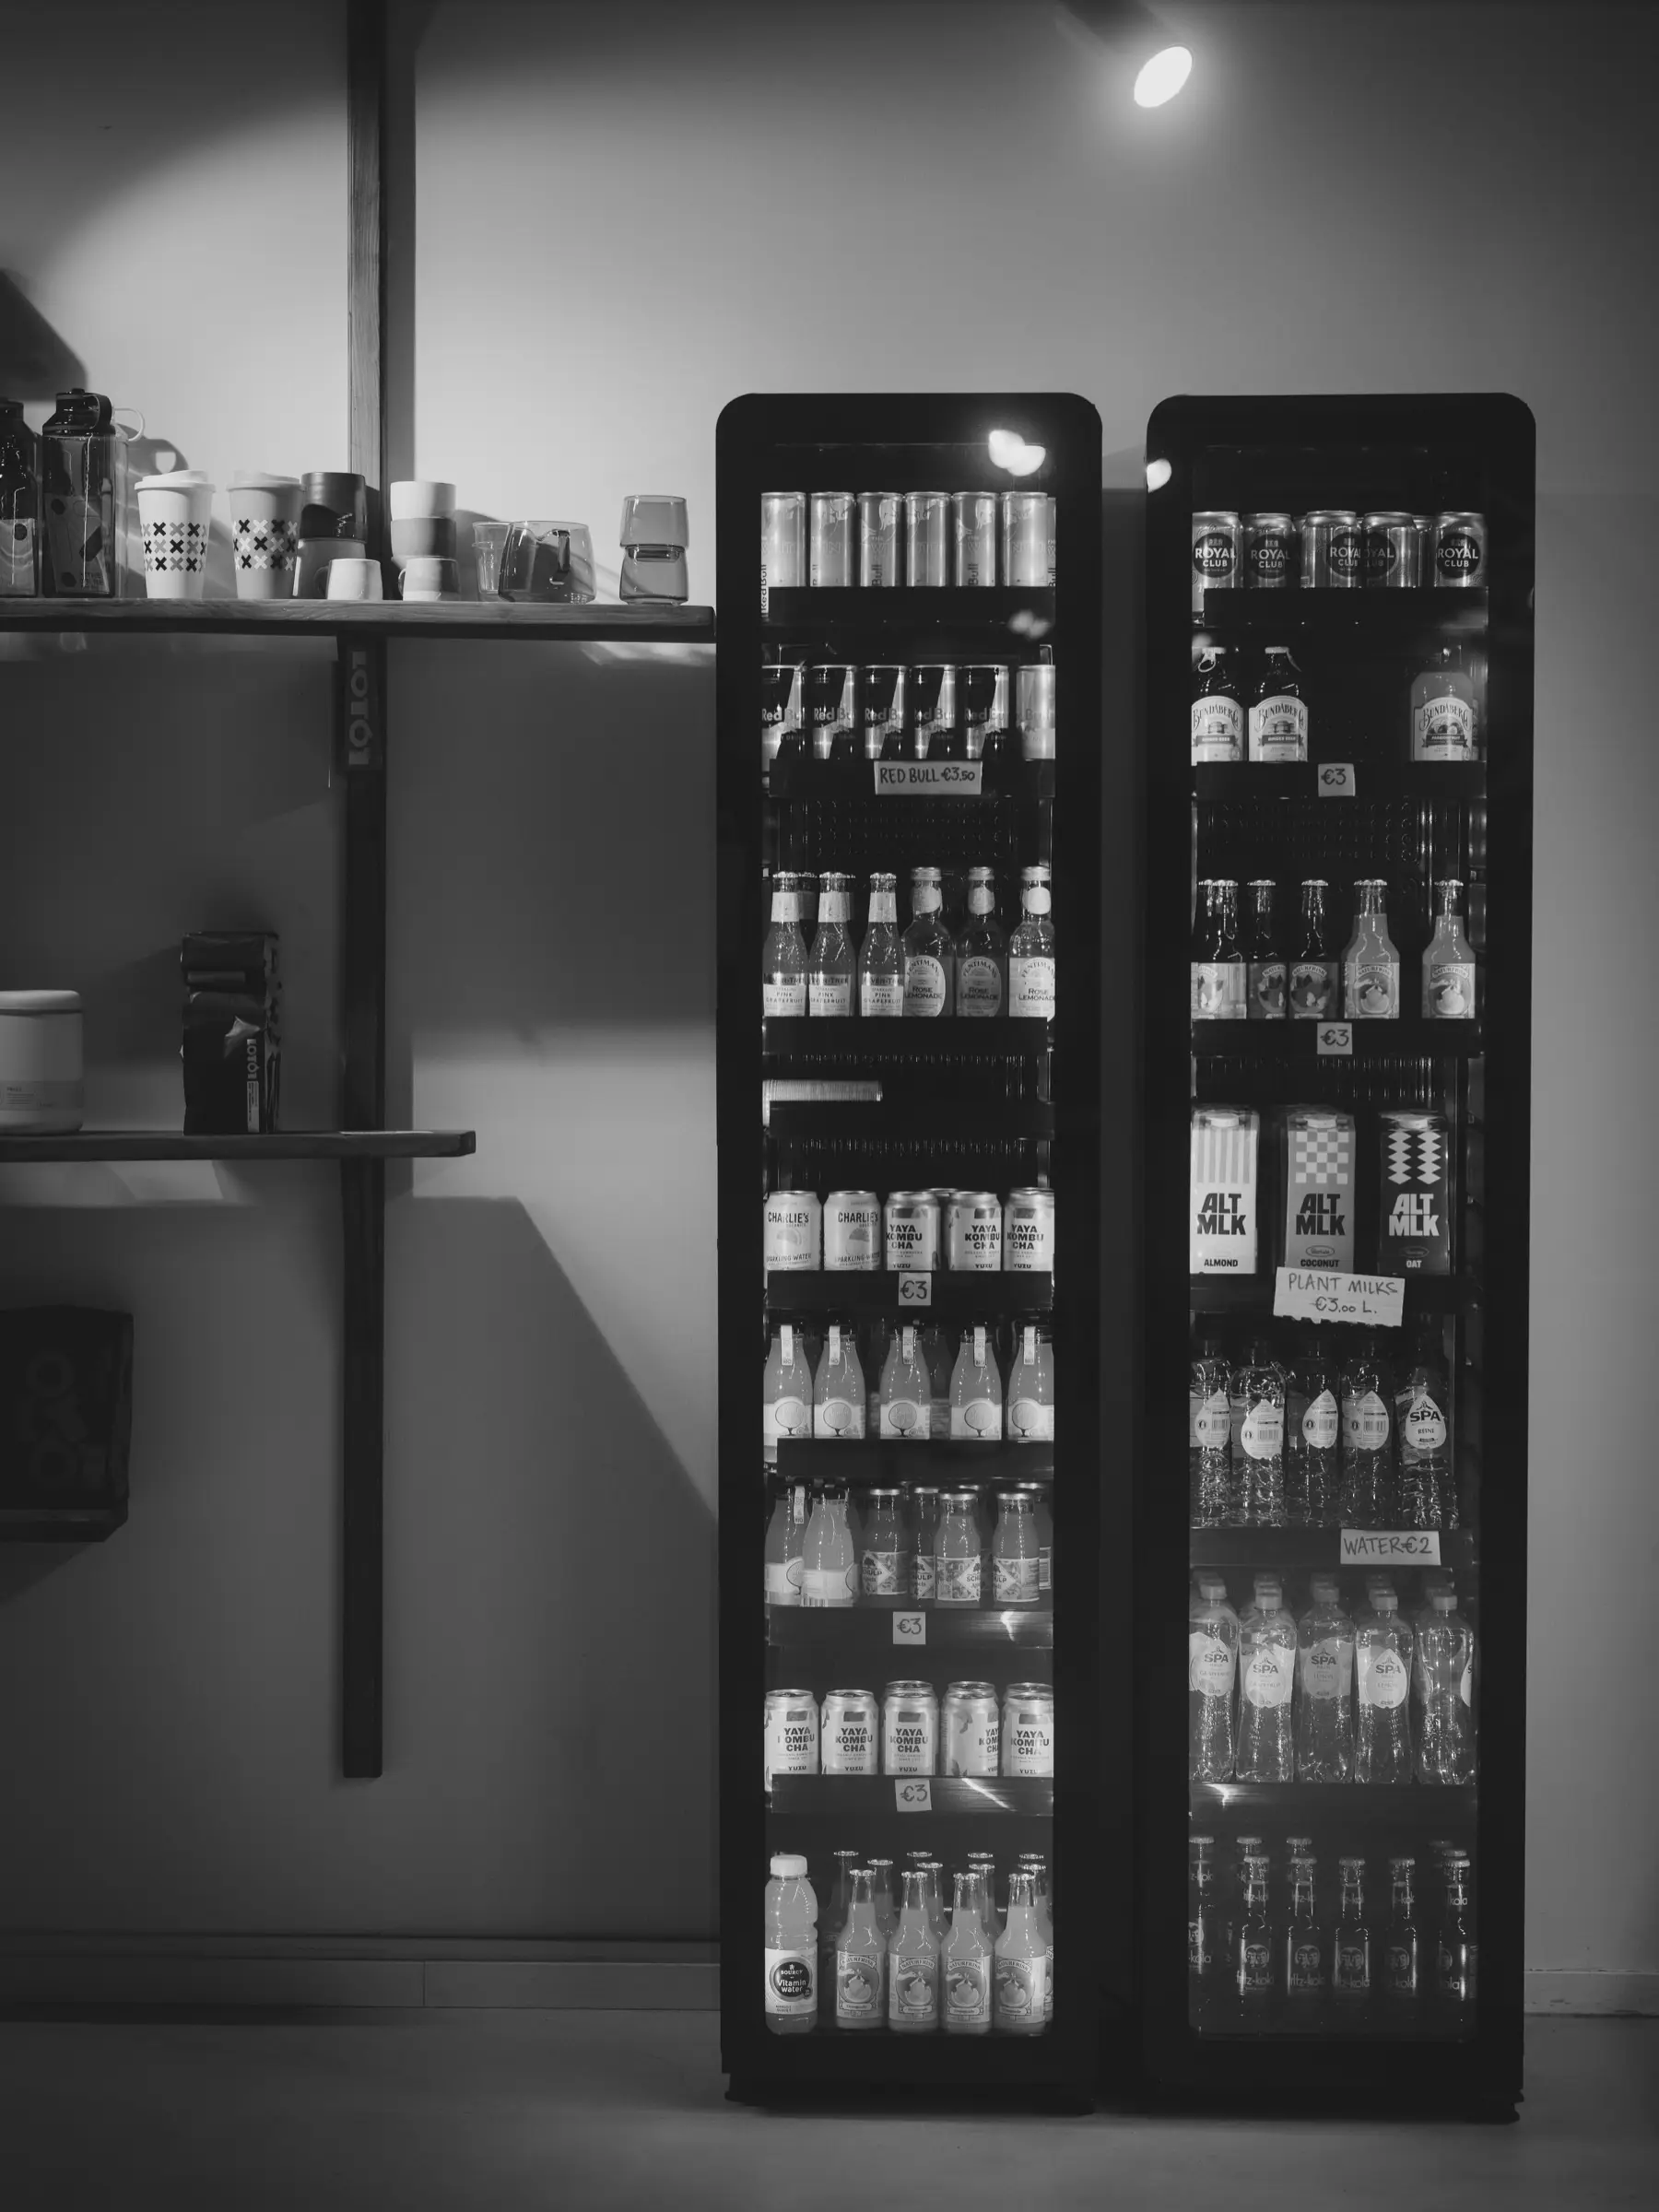
Yes, at the right location. One of our smart coolers cost $4,000 and does about $500 a month in gross sales at a gym. Take out product at 25%, card fees of 4% plus $8, and a 15% commission to the location, and $272 a month is left. $4,000 ÷ $272 = 14.7 months to pay back the machine. That is before our time, sales tax, and shrink, and it depends on the location selling $500 a month. Halve the sales and the payback more than doubles.
The card fee line is 4% × $500 = $20, plus the $8 monthly charge. The commission is 15% × $500 = $75. Operating profit is $500 − $125 − $28 − $75 = $272, an operating margin of 54.4%.
This page is about profit and payback. For what machines take in before costs, see how much vending machines make. To run your own numbers, use the profit calculator.
How the vending machine payback period is worked out
Payback is the machine’s cost divided by its monthly operating profit. Operating profit is sales minus product, payment fees, the location’s commission, and any other monthly cost. Loan payments stay out of it because they repay the machine itself; financing is covered separately below.
Payback says nothing about the months after it. A machine that pays back in 15 months and then loses its location has made back its cost and nothing more. I’d compare the payback period with the term in the location agreement, so the machine has months left to earn after it has paid for itself.
Sales volume moves the payback most
Product, card fees, and commission are mostly percentages of sales. On our ratios, 25% + 4% + 15% = 44% of each dollar goes out, plus the fixed $8. So operating profit = 56% of sales − $8.
The rows below are that formula applied to other sales levels. They are arithmetic on our cost ratios, not results from any machine we run.
| Monthly sales | Operating profit | Payback on $4,000 |
|---|---|---|
| $250 | $132 | 30.3 months |
| $500 (our gym cooler) | $272 | 14.7 months |
| $750 | $412 | 9.7 months |
| $1,000 | $552 | 7.2 months |
| $1,500 | $832 | 4.8 months |
To pay back $4,000 in 12 months, a machine needs $333.33 a month of operating profit. On these ratios that takes ($333.33 + $8) ÷ 0.56 = about $610 a month in sales.
Sales per machine by location type is not published in Automatic Merchandiser’s 2026 State of the Industry summary4, and we found no NAMA figure for it either. Use what the location tells you about headcount and hours, and treat seller projections as marketing.
Smart cooler platform fees
Our coolers run on card fees of 4% plus $8 a month. Most smart cooler platforms charge more, because the software, cellular connection, and recognition are billed on top of processing. Smart cooler monthly fees runs the same $500 month through each platform that publishes its prices: the totals, including processing, run from $64.75 to $177.50.
Putting those totals in place of our $28, with product at 25% and a 15% commission:
| Payment and platform fees | Operating profit | Payback on $4,000 |
|---|---|---|
| $28 (our card fees) | $272.00 | 14.7 months |
| $64.75 (lowest published total) | $235.25 | 17.0 months |
| $177.50 (highest published total) | $122.50 | 32.7 months |
Fixed platform fees take a smaller share as sales rise and a larger one as they fall. At low volume, the platform can matter as much as the location. For a location whose sales I couldn’t estimate, I’d lean toward the platform with the lowest fixed monthly charge.
Financing cost
If you borrow for the machine, interest is a cost the receipt does not show. Most dealers and equipment lenders do not publish a rate; vending machine financing lists the terms that are published. The SBA says microloan rates are generally 8% to 13% (SBA7).
As arithmetic on a $4,000 loan repaid over 36 months:
| Rate | Monthly payment | Total interest | Left each month from $272 |
|---|---|---|---|
| 8% | $125.35 | $512.44 | $146.65 |
| 13% | $134.78 | $851.93 | $137.22 |
At 13%, the machine plus interest costs $4,851.93, which $272 a month covers in 17.8 months. For three years, about half the operating profit goes to the lender. In my view that makes a loan easier to justify for a location that already has a sales history than for an untested one.
Sales tax comes out of the same sales
The receipt has no sales tax line. In California, vending sales are presumed to be tax-included, so the tax is paid out of what the machine takes in (CDTFA Regulation 157410). Cold food is taxed on 33% of receipts and carbonated drinks on 100%. You multiply receipts by the CDTFA’s published factor for your rate, then by the rate (CDTFA factors9).
At a 7.75% rate the factor for cold food is 32.1771%, so $500 of snacks gives $500 × 32.1771% × 7.75% = $12.47 of tax. That takes operating profit to $259.53 and payback to 15.4 months. Swap $100 of that for soda, at a 92.8074% factor, and the tax is $17.17.
Whether the 33% rule covers a smart cooler is unsettled. Publication 118 says an item the customer can reach before paying is not sold through a vending machine (CDTFA8), and a smart cooler unlocks before it charges. Before counting on the 33% rule for a smart cooler, I’d get the CDTFA’s answer in writing. California vending sales tax has the full rules and the other factors. Other states set their own rules.
Shrink
Shrink is product that leaves without being paid for, and it comes straight off profit. No survey publishes shrink for locked smart coolers. For micro markets, where product sits on open shelves, nearly two-thirds of operators in Automatic Merchandiser’s 2026 survey reported shrink below 5%, and 12.5% reported more than 10% (Automatic Merchandiser4). Byte, a smart cooler platform, says mischarges across its fleet average about 0.4% of transaction volume (Byte11).
As arithmetic, shrink of 5% on $500 is $25, which takes operating profit to $247 and payback to 16.2 months.
Your time
Every figure above is before the hours spent driving to the machine and stocking it. If you would rather pay someone for those hours, the Bureau of Labor Statistics puts the May 2025 median wage for coin, vending, and amusement machine servicers and repairers at $22.81 an hour (BLS12). At that wage, $272 pays for $272 ÷ $22.81 = 11.9 hours a month, before payroll taxes and vehicle costs.
The profit calculator takes restock visits per month and hours per visit and divides net profit by your hours. Count the drive in the hours.
Dead locations
A location can close, cut staff, or ask for the machine to go. When that happens, sales stop and the payback clock stops with them. We pay a locator $250 per placement, so replacing a location that way adds $250 to the cost: ($4,000 + $250) ÷ $272 = 15.6 months, plus the months the machine sits unplaced and whatever it costs to move it. We found no published figure for how often vending locations are lost or what a move costs.
What the location agreement says about notice and term protects the payback more than anything on the receipt. Vending locator services covers what to get in writing before paying for a placement.
Published vending machine profit margin data
There is little of it.
- Trade surveys. Automatic Merchandiser’s 2026 State of the Industry summary reports revenue, equipment mix, and shrink, but no margin or profit figure (Automatic Merchandiser4). Vending industry numbers has the rest of it.
- NAMA. The association sold an Operating Ratio Report on operator profit drivers. The latest edition we found in trade coverage is the 2015 one, priced at $225 for members and $395 for nonmembers (Vending Times5). We did not read it, and its figures are not public.
- Public companies. Compass Group owns Canteen, which its 2025 annual report calls its “vending and unattended market business”. Compass reports results for two regions, North America and International, and gives no separate revenue or profit for Canteen (Compass Group6). We found no other US vending operator that publishes its financials.
- Business sales. BizBuySell1 reports that vending businesses sold through it from 2021 to 2025 had median revenue of $71,000 and median discretionary earnings of $39,601, or 55.8% of revenue. Discretionary earnings starts from pre-tax profit and adds back the owner’s salary, interest, and depreciation (BizBuySell2), so it is earnings before paying for the owner’s time. These come from the reported financials of businesses that sold.
- Machine sellers. A vendor blog, VMFS USA3, says net margin per machine “typically settles between 15% and 30%” after commissions, card fees, spoilage, and route costs. It cites no survey.
Our cooler’s 54.4% sits close to BizBuySell’s median, and both leave out the operator’s labor. Neither is a net margin after paying for the work.
Earnings claims from sellers
Sellers of vending packages often show monthly income figures. Under the FTC’s Business Opportunity Rule, a seller who makes an earnings claim must have a reasonable basis for it and written materials that substantiate it at the time the claim is made, and must give the buyer a separate earnings claim statement (16 CFR 437.414). That statement has to say how many purchasers, and what percentage of them, achieved at least the claimed earnings, and over what dates. The rule counts “any chart, table, or mathematical calculation” showing possible results as an earnings claim (16 CFR 437.113).
If a package seller shows you income figures without that statement, ask for it before paying. Turnkey vending business packages covers the one-page disclosure the rule requires and the FTC’s vending cases.