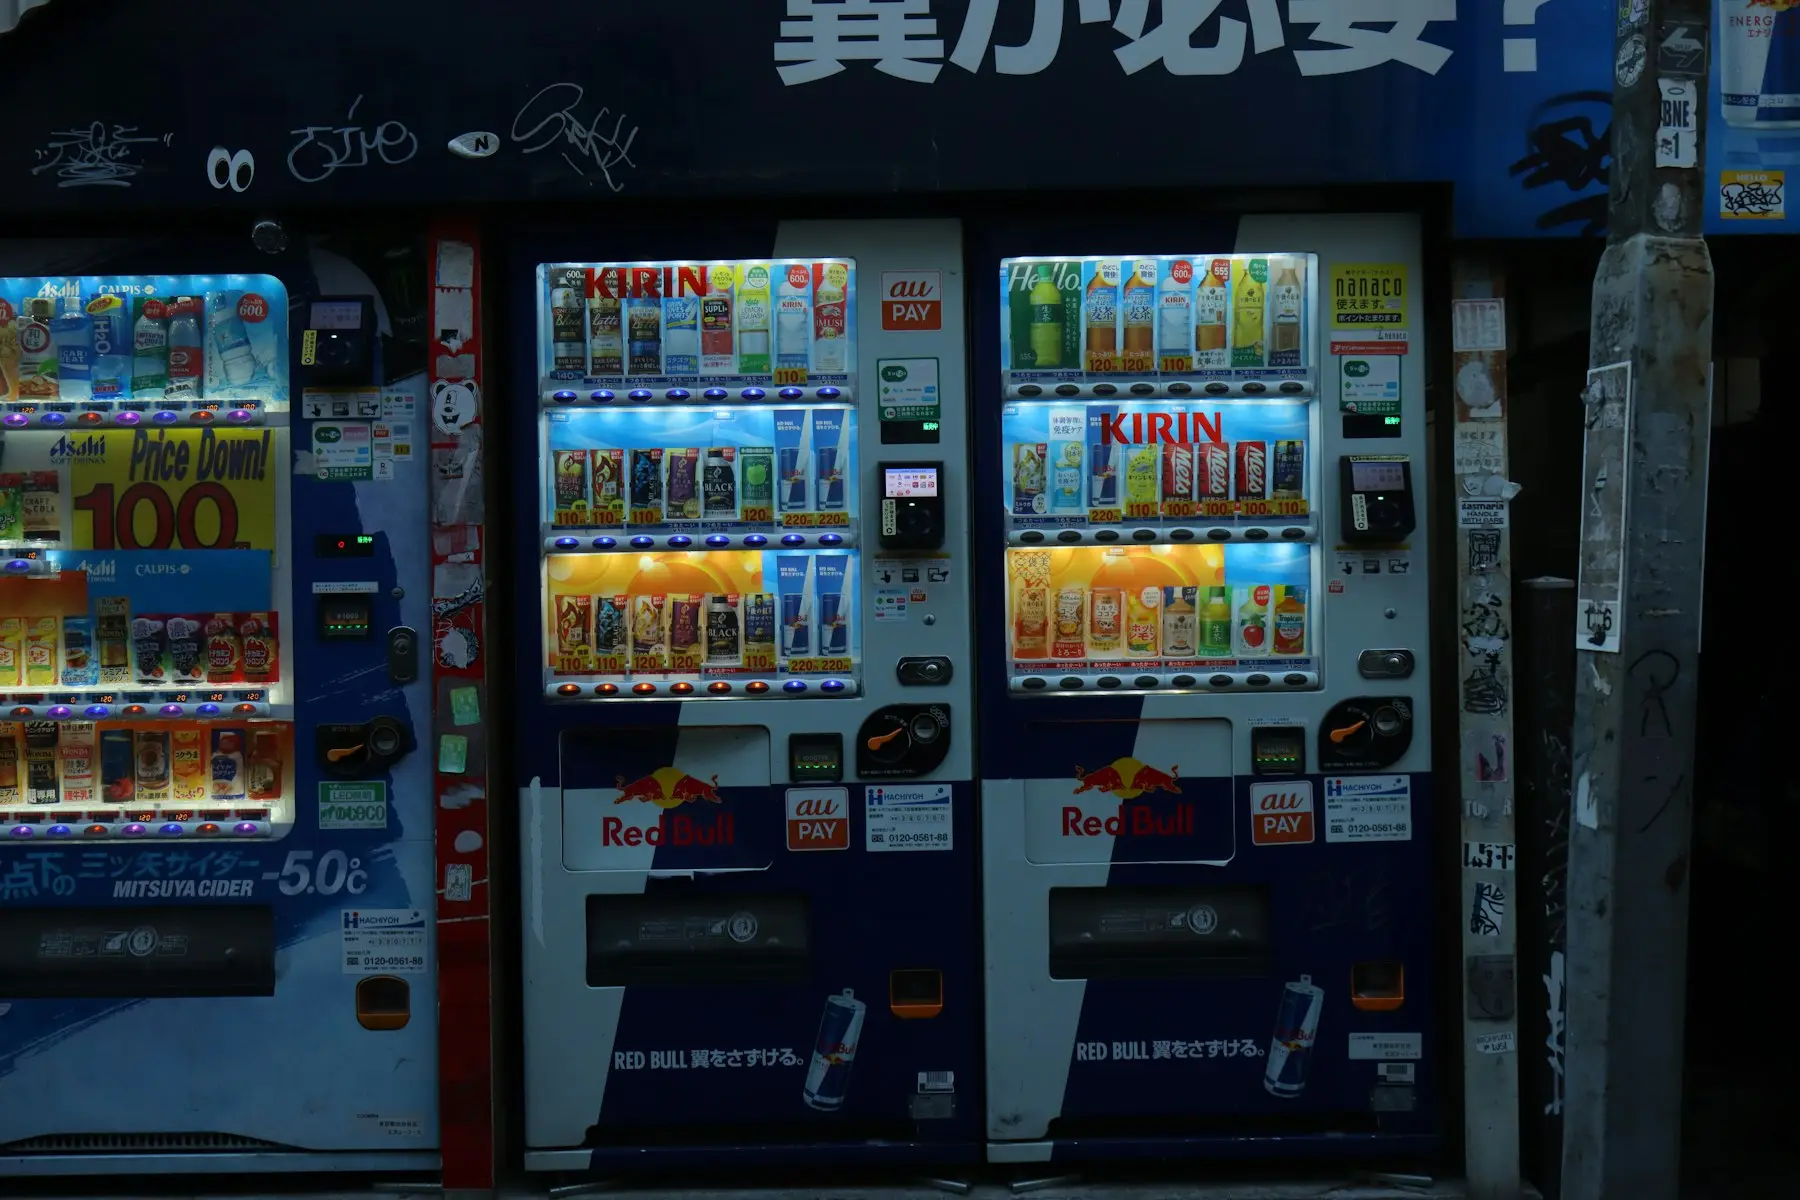
Automatic Merchandiser puts 2025 industry revenue at $40.04 billion. Cantaloupe’s payment data shows 78% of food and beverage vending sales were cashless, with the average card purchase at $2.45 against $1.57 in cash.
Two reports come out each year with numbers on the vending business. Automatic Merchandiser surveys operators for its State of the Industry report1, sent out each spring; the full report needs a free registration, and the figures below are from its published summary. Cantaloupe reports on the payments that run through its own card readers in its Micropayment Trends Report2. Both 2026 editions cover 2025.
Revenue
Automatic Merchandiser put industry revenue at $40.04 billion, up 18.3% from $33.85 billion the year before.
- More than 65% of respondents reported revenue growth in 2025, and fewer than 20% reported a decline.
- More than 70% increased the number of locations they served.
Smart coolers
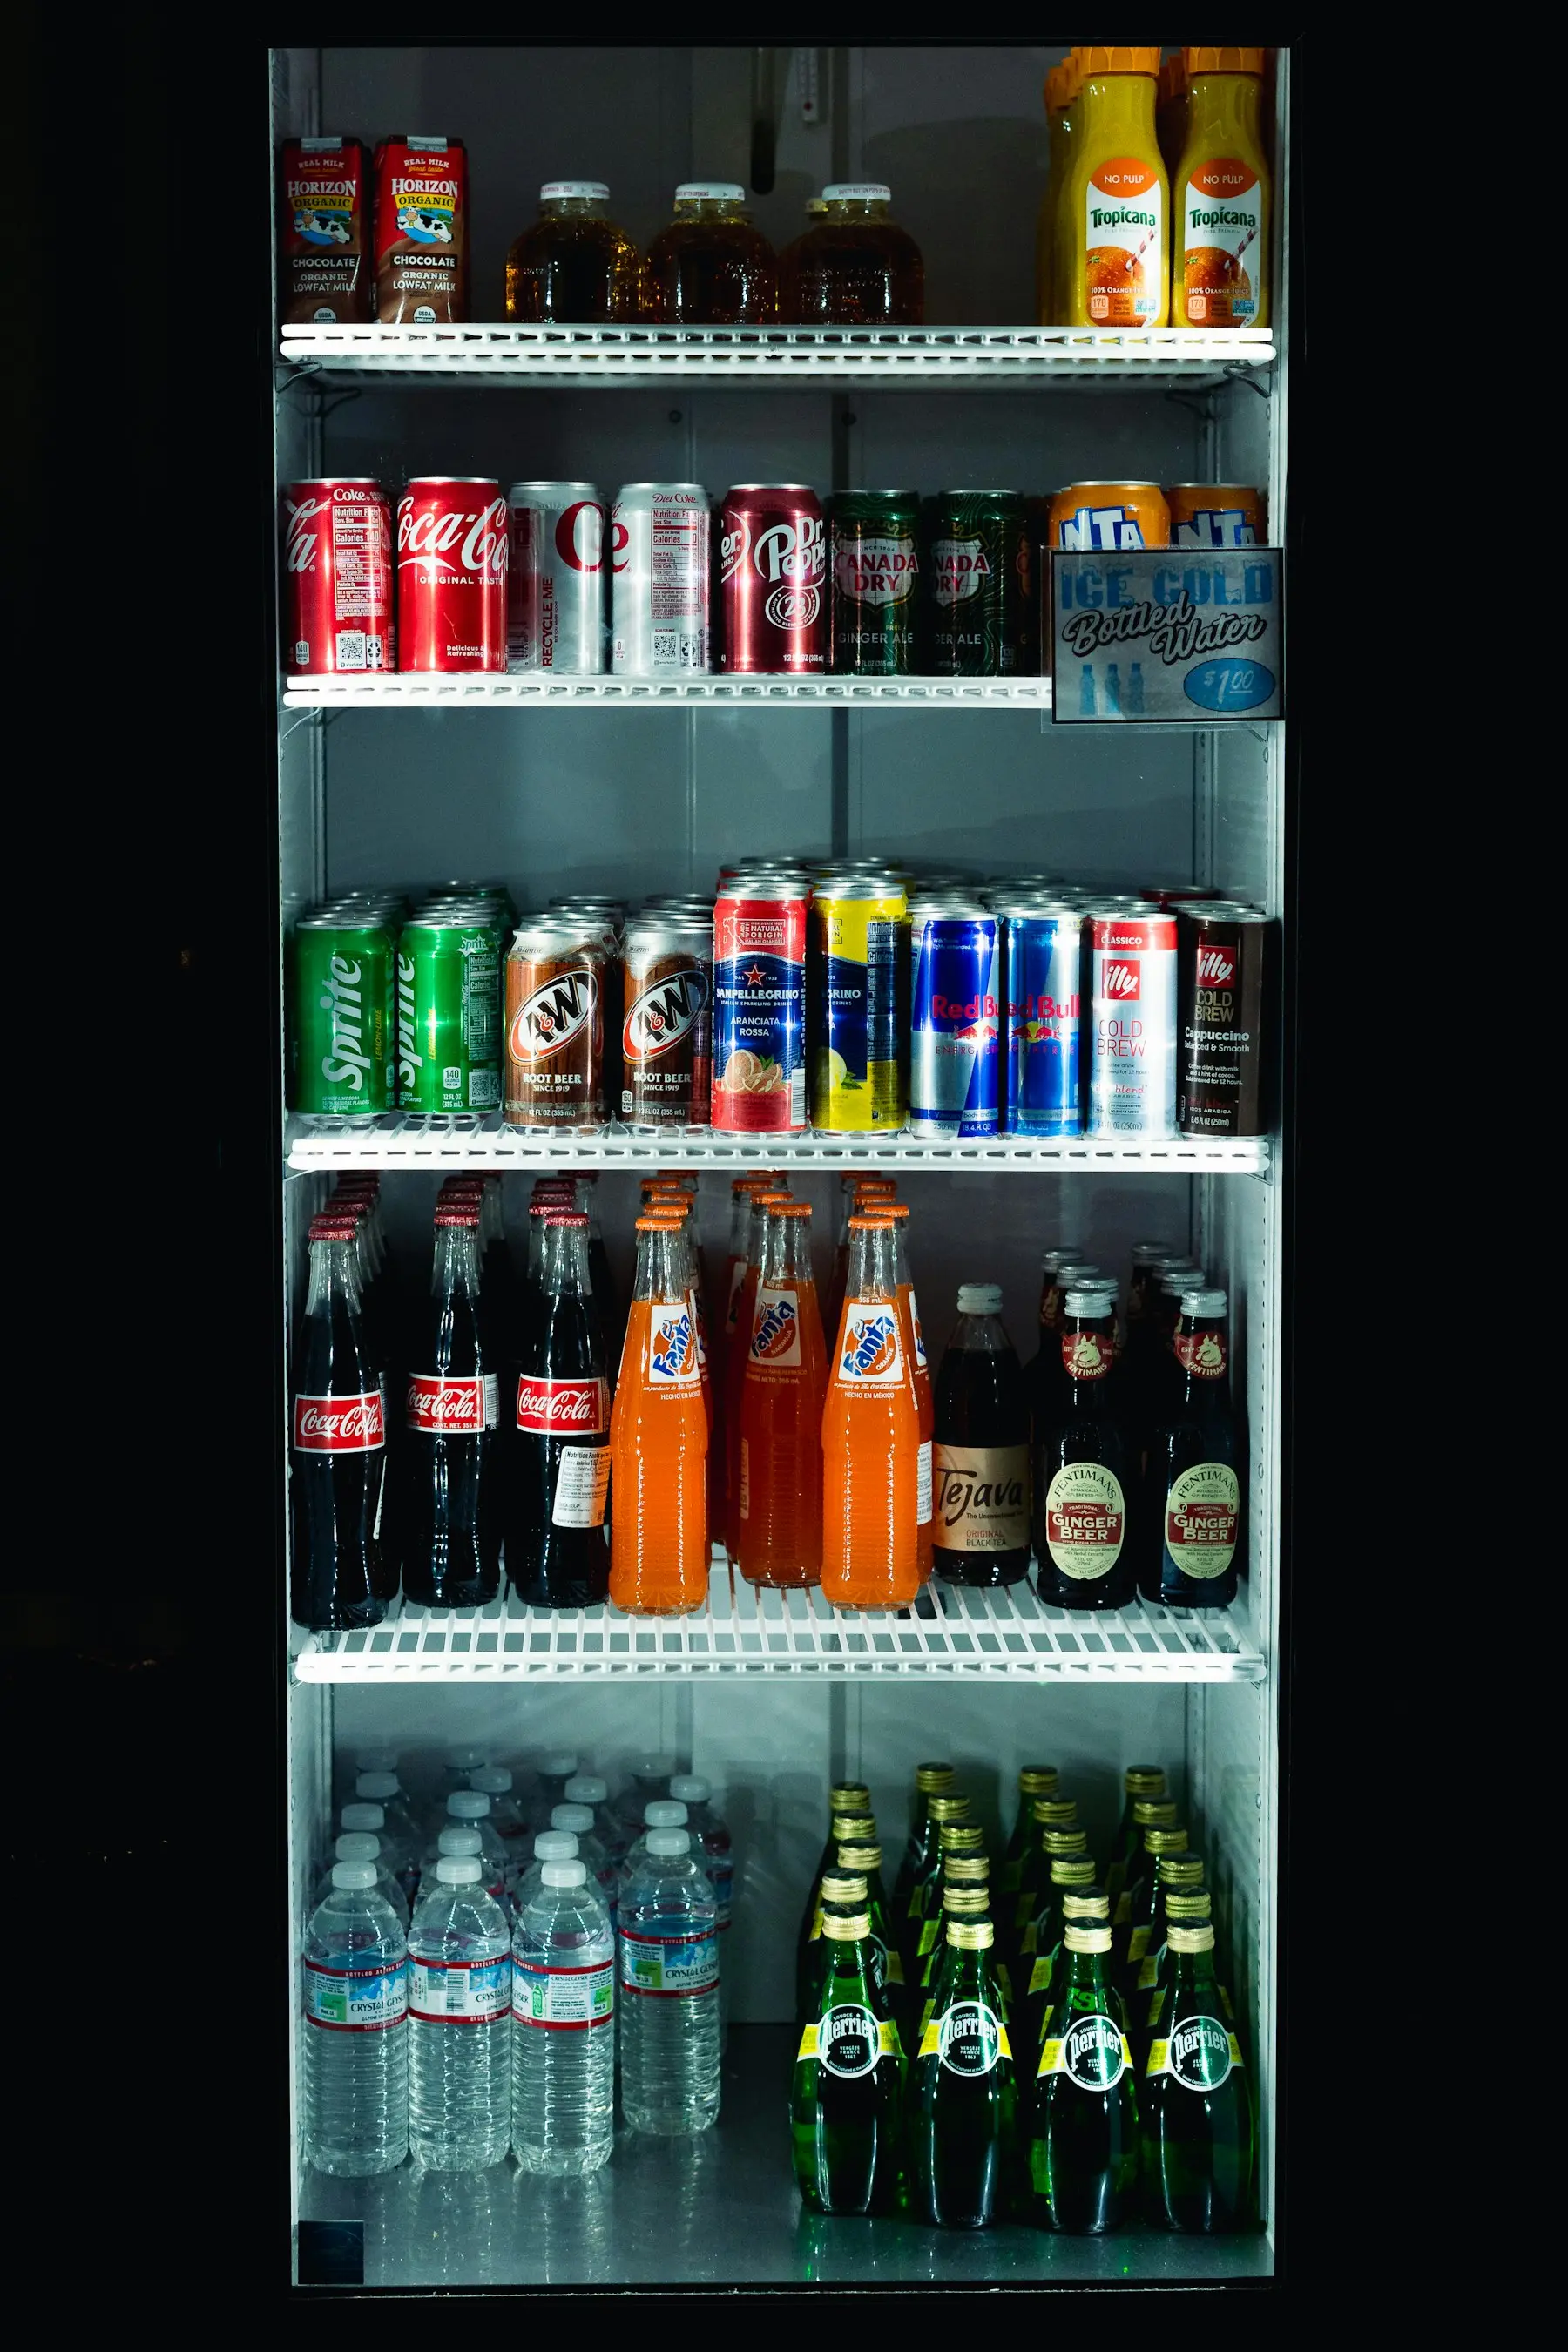
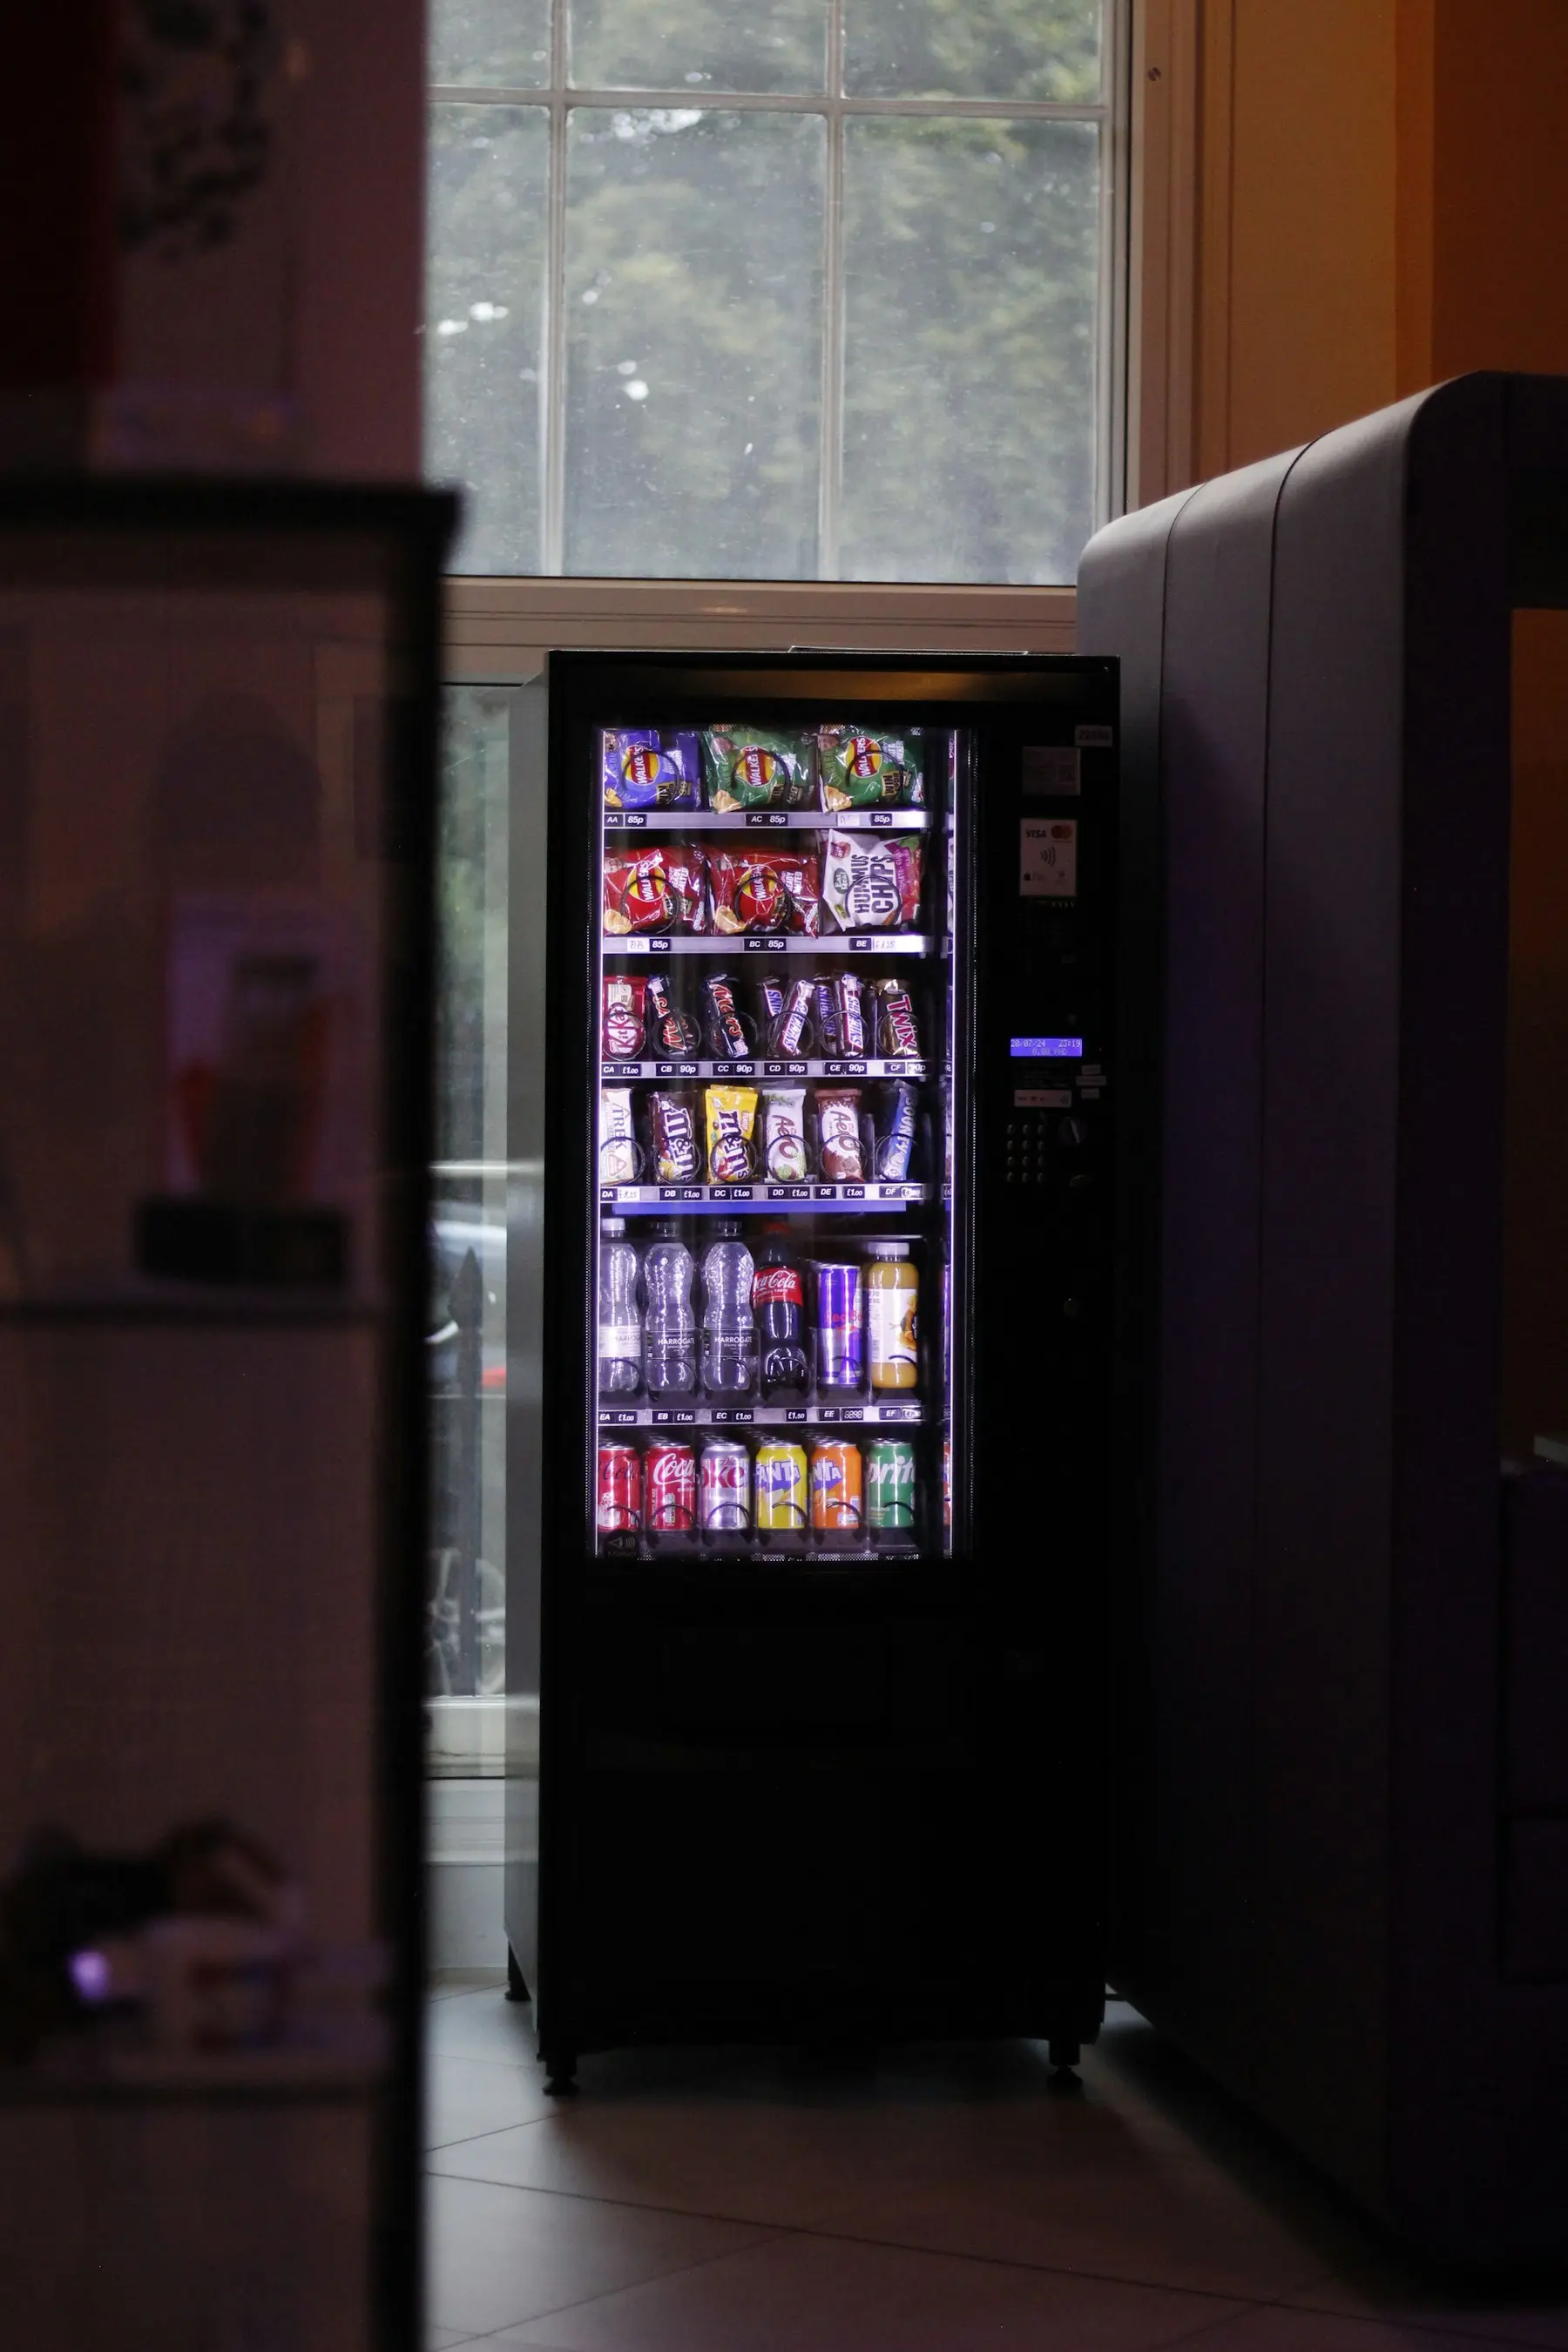
- Smart coolers were 33.5% of the equipment respondents had deployed, close to the share of traditional glass-front machines. Cold drink machines remained the largest single category.
- More than half of respondents operate at least one, and nearly a third named smart coolers a primary operating format.
Cantaloupe’s own figures point the same way. Active locations for its Smart Stores, a weight-and-camera cooler, rose from 71 to 572 during 2025. Cantaloupe has been part of 365 Retail Markets since May 2026: the FTC announced a proposed consent order on the deal on May 1 (FTC10), and 365 announced on May 11 that it had completed the acquisition (365 Retail Markets9). Smart coolers compared has prices and fees for 26 models.
Micro markets
Growth has slowed. 52.4% of respondents reported no change in their number of micro markets in 2025, against 16% in 2023. 38% added micro market locations, against 84% reporting growth in 2023.
What sells
Asked about better-for-you products, respondents’ answers were 27% jerky, 18% protein bars, and 18% fresh food, together 63% of responses. Snacks, candy, and sweet baked goods still make up more than a third of vending and smart cooler sales.
Card payments
From Cantaloupe’s network:
| Measure | 2025 |
|---|---|
| Share of food and drink vending sales that were cashless | 78% |
| Average cashless purchase | $2.45 |
| Average cash purchase | $1.57 |
| Average purchase overall | $2.01 |
| Average purchase at a micro market | $3.02 |
| Average purchase at a Cantaloupe Smart Store | $4.49 |
| Contactless share of cashless sales | 85% |
| Consumer spending at Cantaloupe-tracked vending machines | Over $3.3 billion, up 5% |
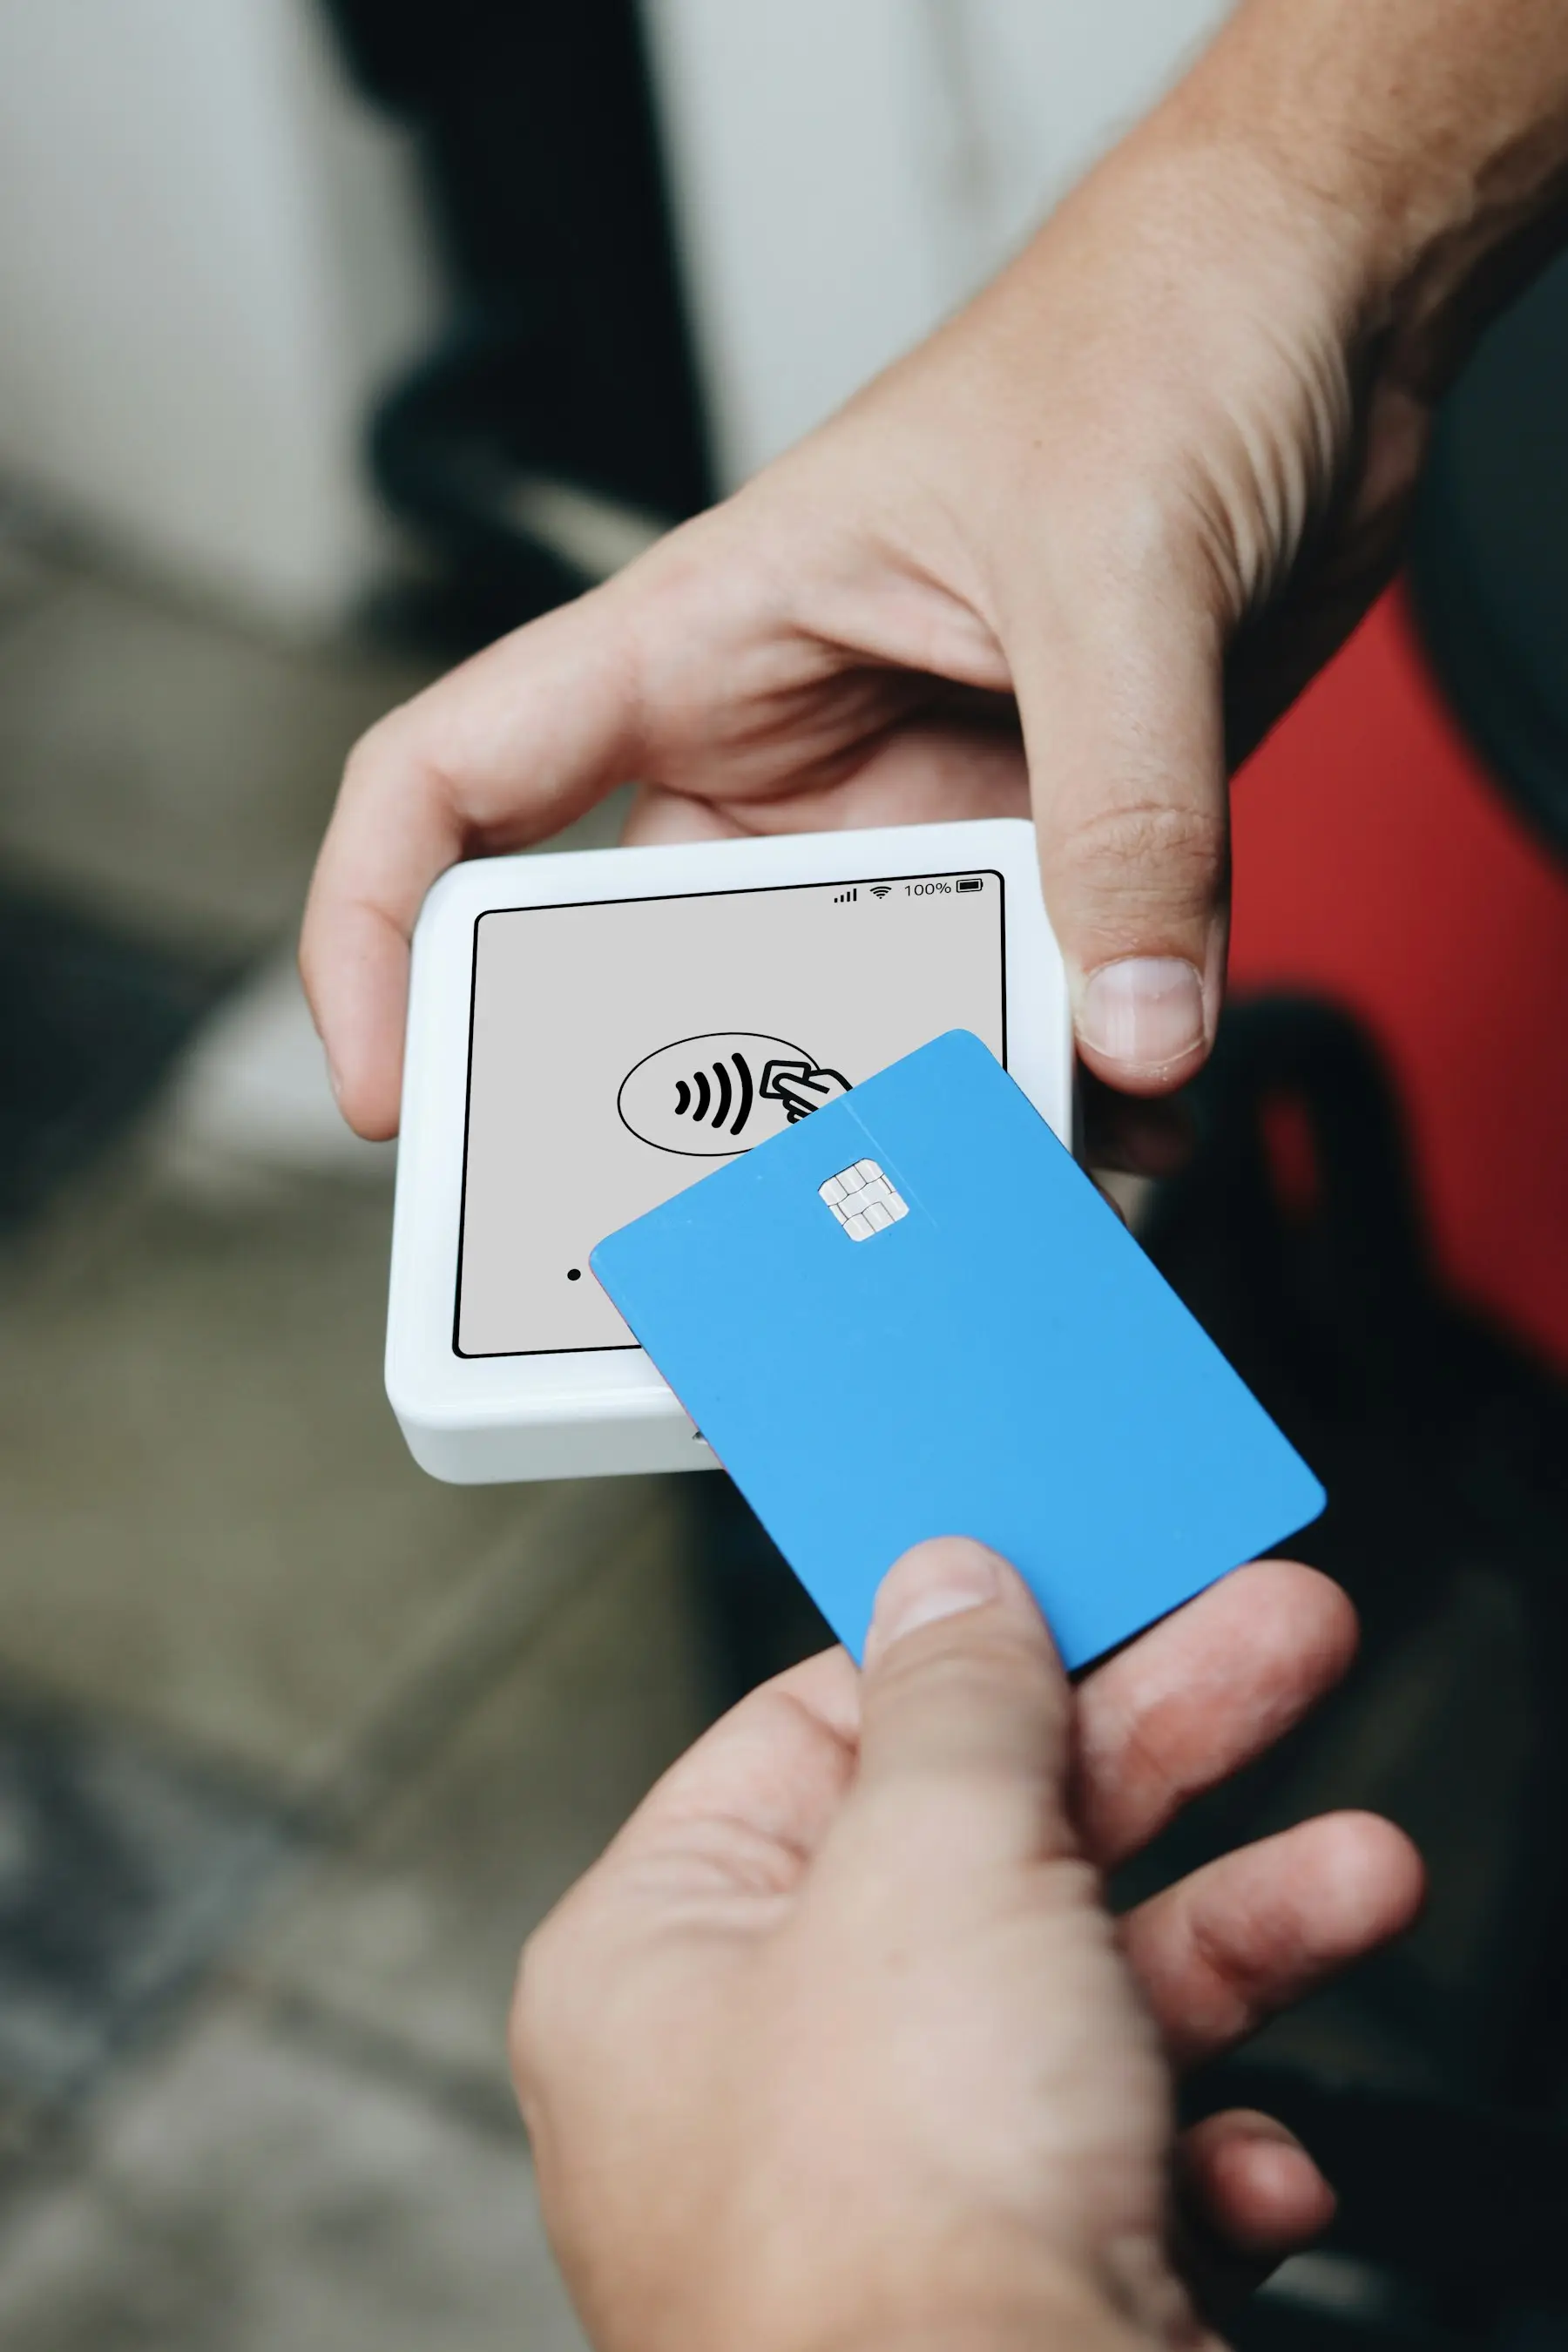
A card purchase was 56% larger than a cash one on the rounded averages; Cantaloupe’s page labels the gap +59%. At amusement machines, cards were 37% of transactions but 79% of sales by value.
Some operators charge card users more. Cantaloupe’s store describes an optional two-tier pricing setting8 that adds ten cents to card and mobile-wallet sales to help cover processing. What each reader charges is in card readers compared.
The two Cantaloupe reports do not line up
Trade coverage of the 2025 report3 gave figures for 2024 that differ from what the 2026 report says about the same year:
| 2024 figure | 2025 report, as covered | 2026 report |
|---|---|---|
| Cashless share of vending sales | 71% | 73% |
| Contactless share of cashless sales | 77% | 78% |
| Average vending transaction | $2.11 | $1.99 |
The 2025 coverage also put 2024 vending sales at $3.5 billion, while the 2026 report gives over $3.3 billion for 2025 as a 5% increase. Neither report explains the change. The figures describe machines with a Cantaloupe reader, not all machines, so cite the report and year with any number you use.
Shrink
Automatic Merchandiser’s shrink figures are for micro markets, where product sits on open shelves:
- Nearly two-thirds of respondents reported shrink below 5%.
- 12.5% reported shrink above 10%.
The 2024 edition4 put most operators between 3% and 7%, and an earlier edition5 between 3% and 5%. Panoptyc, which sells micro market loss prevention, told the trade press it sees an average near 6% and has seen single locations at 25% to 50%. Those are a vendor’s figures.
For comparison, William Blair6 cites the National Retail Federation’s average retail shrink of 1.6% of sales and says 89% of micro market operators exceed it.
In the 2026 survey, cameras connected to a monitoring service were the most common deterrent, followed by camera feeds shown above the kiosk and signs saying theft is monitored.
No published figure exists for shrink in locked smart coolers. The vendors describe their machines as theft-proof and give no numbers. The nearest is an error rate: Byte says mischarges7 across its fleet average about 0.4% of transaction volume.
What vending businesses sell for
Vending businesses sold through BizBuySell from 2021 to 2025 went for a median $83,500, about 2.15 times owner earnings, per its valuation benchmarks11. Buying a vending route has the full table and current listings.
Not published anywhere we could find
Neither report’s public summary gives average sales per machine or the average commission paid to locations, and we found no NAMA or trade-press figure for either.